
For merchants on Shopify, WooCommerce, BigCommerce, Amazon, and any platform processing card-not-present volume through a peak season. Updated August 2026.
Direct Answer
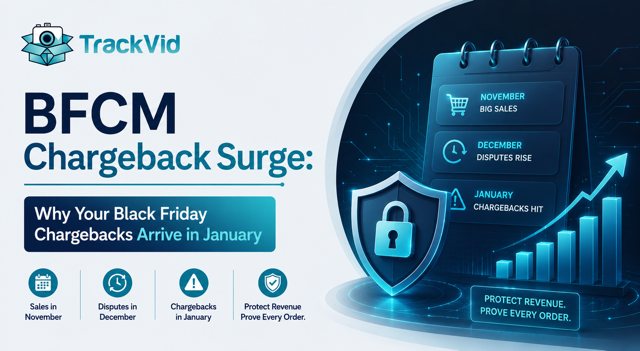
The BFCM chargeback surge is the concentrated wave of card disputes that lands 6 to 12 weeks after Black Friday and Cyber Monday, peaking in January and February. It is dangerous for a reason most merchants miss: chargeback ratios are calculated against settled transactions in the month the dispute posts, not the month the order was placed. So November disputes get divided by January sales, and January sales collapse after peak. A merchant whose absolute fraud never changed can watch their ratio triple on arithmetic alone. Visa tightened the VAMP merchant Excessive threshold from 2.2 percent to 1.5 percent on April 1, 2026, with $8 per dispute and no warning tier, and Mastercard's Scam Merchant Monitoring Program took full effect on July 24, 2026, flagging card-not-present merchants when combined refunds and chargebacks cross 5 percent of transactions in a rolling 30-day window. The post-holiday period is the one window where refunds and chargebacks peak simultaneously.
What Is the BFCM Chargeback Surge?
The BFCM chargeback surge is the seasonal concentration of card-not-present disputes generated by Black Friday and Cyber Monday orders, arriving on merchant accounts between late December and early March.
It is not the same problem as peak-season return fraud, and conflating the two is why many merchants prepare for the wrong thing. A return runs through you or your marketplace. A chargeback runs through the card networks, bypasses you entirely at the moment it is filed, and carries consequences a return never does: fees, ratio damage, monitoring program exposure, reserve requirements, and in the worst cases loss of card acceptance.
Three separate dispute populations feed the surge, and they behave differently:
Population 1: True fraud disputes. Stolen card and account takeover transactions placed during peak, disputed once the real cardholder sees the statement. Sift's Global Data Network recorded account takeover attack rates climbing from 1.64 percent to 1.87 percent across BFCM, and separate industry reporting has recorded ATO attempts rising sharply during peak because credential-stuffing attacks blend into surge traffic.
Population 2: First-party misuse, also called friendly fraud. The cardholder received the goods and disputes anyway. ACI Worldwide projected a 25 percent rise in friendly fraud across the Thanksgiving to Cyber Monday window, with the average friendly-fraud transaction value climbing to $291, up 21 percent year on year. This is the largest population for most merchants and the one that responds best to evidence.
Population 3: Service and confusion disputes. Unrecognised billing descriptors, gift purchases the cardholder does not remember authorising, delayed delivery, and duplicate-charge confusion. Entirely preventable, and disproportionately common at peak because gift buyers shop unfamiliar stores and forget them by the time the statement arrives.
The mix matters because your defense differs by population. Population 1 needs pre-transaction screening. Population 2 needs dispatch evidence and representment. Population 3 needs clearer descriptors and better communication. A merchant who deploys one defense against all three loses money on two of them.
For the returns side of peak season, which is a genuinely separate problem with separate deadlines, see our Black Friday Return Fraud playbook at trackvid.in.
Your November chargebacks are not a November problem. They are a February ratio problem wearing a November costume.
Why Do Black Friday Chargebacks Arrive in January and February?
The lag is structural, and every part of it is predictable.
The mechanical chain:
A cardholder makes a purchase on Black Friday. Depending on their billing cycle, that charge appears on a statement anywhere from a few days to five weeks later. Most people do not review statements the day they arrive. Many review them in the first week of January, when holiday spending gets reconciled against reality.
The cardholder then contacts their issuer. The issuer opens the dispute. Depending on the network and reason code, the dispute posts to the merchant within days. Card networks generally allow cardholders 120 days from the transaction or from the expected delivery date to file, which stretches the tail of a late-November order well into March.
Sift's peak-season analysis states the mechanism plainly: holiday account takeover surges lead to higher disputes in the following quarter, because compromised accounts are monetised at peak and only surface on billing statements weeks later.
The realistic BFCM chargeback surge timeline:
| Window | What happens | Merchant impact |
|---|---|---|
| Nov 27 to Dec 1 | Peak transaction volume. Fraud and first-party misuse enter the book | None visible. Evidence either is or is not being captured |
| Dec 2 to Dec 31 | Statements issue. First TC40 fraud reports post from issuers | Early warning signal available, and almost never monitored |
| Jan 1 to Jan 31 | Statement reconciliation. Dispute filings accelerate sharply. Post-holiday refund wave runs in parallel | First ratio impact. Refunds and chargebacks stack in the same window |
| Feb 1 to Feb 28 | Peak dispute arrival. Representment deadlines run. Monitoring program calculations land | Highest ratio month of the year for most merchants |
| Mar 1 onward | Tail disputes on late-November and December orders. Program enforcement, fees, reserves | Structural cost that outlasts the season |
First, your dispute numerator is at its annual maximum because it is fed by November and December order volume.
Second, your settled transaction denominator is at its annual minimum because January and February are the slowest months in most retail calendars.
That collision is the entire subject of the next section, and it is the single most expensive thing most merchants do not know about peak season.
How Is Your Chargeback Ratio Actually Calculated in 2026?
Here is the formula that governs Visa's monitoring program:
VAMP Ratio = (Reported Fraud Transactions + Disputes) ÷ Total Settled Transactions
Read that denominator carefully. It is total settled transactions in the measurement month, not in the month the disputed orders were placed.
This produces what is best described as the denominator trap.
Work a simple example. A merchant settles 40,000 transactions in November during peak. They settle 9,000 in February, which is normal for a seasonal business. Suppose 600 disputes and fraud reports arising from November orders land in February.
If you measured those 600 against the November volume that produced them, the ratio would be 1.5 percent. Measured against February's 9,000 settled transactions, the same 600 events produce a ratio of 6.67 percent.
Nothing about the merchant's fraud rate changed. Their customers did not get worse. Their product did not get worse. The ratio moved by a factor of four because of which month the disputes chose to arrive in.
Two further mechanics make this sharper in 2026 than it was in prior years:
The double-count. A single bad transaction can enter the numerator twice. If the cardholder's bank first reports it as fraud, generating a TC40 record, and the cardholder later escalates it into a formal chargeback, generating a TC15 record, both events land in your numerator. VAMP consolidated fraud and dispute monitoring into a single combined ratio, which is why the tighter threshold bites harder than the headline percentage drop suggests.
The Mastercard overlay. Mastercard's Scam Merchant Monitoring Program took full effect on July 24, 2026 and works differently. It can flag a card-not-present merchant once combined refunds and chargebacks cross 5 percent of transactions over a rolling 30-day window, with no separate warning tier before enforcement begins.
Look at that combination against the post-holiday calendar. January is simultaneously the biggest refund month of the year, driven by the post-Christmas return wave, and a top-two chargeback month. Those are the two components of the SMMP numerator, peaking together, measured against the year's thinnest transaction volume. No other month in the retail calendar stacks all three conditions.
Practical implication: if you have only ever tracked chargebacks as a dollar loss, you have been watching the smaller number. The ratio is what triggers enforcement, and the ratio is seasonal in a way the dollar loss is not.
What Happens If You Cross the 1.5 Percent VAMP Threshold?
Visa tightened the VAMP merchant Excessive threshold from 2.2 percent to 1.5 percent on April 1, 2026, applying across the US, Canada, EU, and APAC, with CEMEA merchants retaining 2.2 percent.
What changed and why it matters:
- The threshold dropped by roughly a third, which means merchants who sat comfortably between 1.5 and 2.2 percent found their compliance position flipped without any increase in dispute volume.
- Fines run at $8 per dispute, administered through your acquirer.
- There is no warning tier. Older programs gave merchants a grace period. This one does not.
- A volume floor applies. Merchants processing fewer than 1,500 combined fraud reports and disputes per month sit outside formal monitoring, though acquirers routinely enforce stricter internal limits well below Visa's published threshold, which is the part that catches smaller merchants.
- Acquirers face their own ceiling. Acquirer-level VAMP ratios tightened to 0.5 percent from January 1, 2026, and because Visa grades portfolios in aggregate, a single problem merchant can drag an acquirer's whole book. This is why acquirers act on their own merchants faster and more aggressively than the published thresholds imply.
Mastercard runs parallel exposure. The Excessive Chargeback Program flags merchants at 100 or more monthly chargebacks combined with a ratio at or above the program threshold, meaning even a moderate absolute dispute count can create status risk. Mastercard also raised excessive authorization attempt fees from $0.10 to $0.50 per retry, a fivefold increase that compounds quickly during card-testing attacks, which themselves cluster around peak traffic.
The consequences that actually hurt are not the fines. They are the second-order effects: your acquirer requiring a remediation plan, a rolling reserve withheld against future settlements at exactly the point in the year when your cash position is weakest, higher processing rates on renewal, and in persistent cases account termination that forces you into high-risk processing at materially worse economics.
A merchant who plans for the fine has misread the risk. The reserve is what damages the business, because it lands in Q1 when peak inventory has already been paid for and revenue has not yet recovered.
For the underlying profitability arithmetic this feeds into, see our Where Ecommerce Profit Margins Leak playbook at trackvid.in.
The 5-Step BFCM Chargeback Surge Defense
The framework below is built around the timing problem specifically. Every step exists to move outcomes out of the February measurement window or to strengthen what you can prove once you are in it.
Step 1: Forecast Your Seasonal Ratio, Not Just Your Dispute Count
Run this calculation in September, before anything is committed.
- Pull last year's monthly settled transaction counts and monthly dispute and fraud-report counts.
- Identify your worst historical month by ratio, not by dispute volume. For most seasonal merchants it is February.
- Project this year: apply your expected peak growth to November volume, apply your historical dispute rate, then divide the resulting disputes by your projected February settled volume, not November's.
- Compare the output against 1.5 percent for VAMP, and separately model refunds plus chargebacks against 5 percent for SMMP exposure.
Most merchants running this for the first time discover their projected February ratio is two to five times their annual average. That number is the actual planning input, and almost nobody calculates it.
Step 2: Close the Denominator Gap With a Deliberate January Revenue Plan
This step is unusual and it is the highest-return item on the list, because it attacks the arithmetic rather than the fraud.
If February disputes are divided by February settled transactions, then February settled transactions are a lever you control.
- Extend the promotional calendar past the peak rather than concentrating everything in a four-day window. Spreading demand raises the denominator in the months the disputes land.
- Run a January retention and replenishment campaign targeting BFCM first-time buyers. This is a revenue action and a compliance action at the same time, which is rare. Our Repeat Purchase Rate playbook and Post-Purchase Experience playbook at trackvid.in cover the sequences that convert peak buyers into January orders.
- Review capture timing on pre-orders and backorders so settlement is not bunched artificially into a single month.
- Model the effect before you commit. A 30 percent lift in January and February settled volume reduces your ratio by roughly the same proportion, which for many merchants is the difference between sitting under and over the Excessive line.
To be direct about the limits: this reduces ratio exposure, not fraud. It buys headroom while steps 3 through 5 reduce the numerator. It is not a substitute for them.
Step 3: Deflect Disputes Before They Become Chargebacks
A dispute deflected pre-chargeback never enters your numerator at all, which makes this the cheapest ratio reduction available.
- Fix your billing descriptor first. Unrecognised descriptors are among the most common causes of avoidable disputes and they spike at peak because gift buyers purchase from unfamiliar stores. The descriptor should carry a recognisable brand name and a working support number.
- Enrol in pre-dispute alert networks ahead of peak, not during it. Alert programmes notify you of an incoming dispute and allow a refund inside a short window, resolving the case before it becomes a chargeback. Enrolment and integration take time, so this is a September action.
- Monitor TC40 fraud reports through December. These post before the corresponding chargebacks and are the earliest available signal that something in your November cohort is going wrong. Most merchants never look at them.
- Send an order confirmation that names the descriptor explicitly. One line stating exactly how the charge will appear on a statement removes an entire dispute category.
- Keep delivery communication tight through the gift window. A large share of Population 3 disputes are delivery anxiety that a proactive exception alert would have absorbed. See our WISMO Reduction playbook at trackvid.in.
Step 4: Capture Representment-Grade Evidence at Dispatch
Everything in steps 1 to 3 reduces how many disputes reach you. This step decides how many of them you win, and it is the only step that cannot be executed retroactively.
A representment is decided on documentation submitted inside a fixed window. In February you cannot create evidence about a November parcel. You can only retrieve it.
The dispatch record needs to capture, per order and linked to the Order ID: the item, the quantity, the condition, a calibrated weight, a tamper-evident seal, and the shipping label in the same frame. That artefact combines with your tracking, delivery confirmation, and transaction data to form a submission an issuer can act on.
Deploy this before peak rather than during it. Systems introduced under surge volume get abandoned under surge volume.
For the card-network specifics on how this evidence is packaged, we have dedicated guides on compelling evidence requirements per network, plus platform-level guides for Stripe, PayPal, and Shopify dispute submission at trackvid.in. This blog deliberately does not repeat them, because the seasonal problem is a timing and ratio problem rather than an evidence-format problem.
Step 5: Staff the Representment Queue for February, Not November
The final failure mode is the most avoidable one. Merchants build a peak-season plan that ends on December 31, and the dispute wave arrives after the plan expires.
- Forecast February dispute volume in September and assign named owners with capacity, not spare capacity.
- Diary the representment deadlines by network and treat them as hard. An unsubmitted representment is an automatic loss and it still counts in your ratio.
- Prioritise by reason code, not by value. First-party misuse cases with strong dispatch evidence have the highest win probability per hour spent. True fraud cases with no delivery signature typically do not.
- Track win rate weekly through the wave, because a representment process that is failing is worth knowing about in week two rather than week eight.
- Run a post-season audit inside 30 days of the wave ending, feeding what you learn into next September's forecast. Our Sale Season Operations Playbook at trackvid.in covers the audit structure.
Case Study: VAMP Ratio 1.71 Percent Down to 0.63 Percent
A consumer electronics and home technology D2C brand selling through Shopify and two marketplaces processed approximately $6.8 million across November and December, roughly 38 percent of annual revenue. Average order value $184, which is high enough that individual disputes carry real weight.
The prior season, with no seasonal ratio planning in place:
- Annual chargeback ratio: 0.44 percent, comfortably inside every threshold
- November settled transactions: 37,200. February settled transactions: 8,900
- Disputes and fraud reports landing in February: 152
- February VAMP ratio: 1.71 percent, above the 1.5 percent Excessive line
- Representment win rate: 22 percent
- Net chargeback loss across the wave: approximately $246,000
- Consequence: acquirer imposed a remediation plan and a rolling reserve in Q1, against inventory already paid for in September
The founder's summary was that the business looked healthy every month of the year except the two months that decided its processing terms.
What changed the following season:
September: seasonal ratio forecast run properly. Projected February ratio came out at 1.6 percent before intervention, which turned an abstract risk into a board-level number.
October: billing descriptor rewritten with brand name and support number. Pre-dispute alert enrolment completed. TC40 monitoring added to the weekly payments review. Order confirmation updated to state the statement descriptor explicitly.
Late October: Order ID-linked dispatch evidence deployed via TrackVid across all pack stations, with calibrated weight capture and tamper-evident sealing, four weeks before peak.
November and December: promotional calendar extended into a January clearance and replenishment programme rather than concentrating everything in the BFCM window.
January and February: two named owners on the representment queue with forecast capacity, prioritised by reason code, win rate reviewed weekly.
Results across the following surge window:
- February settled transactions: 8,900 to 13,400, a 51 percent lift from the extended calendar and January retention campaign
- Disputes and fraud reports landing in February: 152 to 84, a 45 percent reduction from descriptor fixes and pre-dispute deflection
- February VAMP ratio: 1.71 percent to 0.63 percent, clearing the Excessive line with material headroom
- Representment win rate: 22 percent to 74 percent
- Combined refunds plus chargebacks as a share of transactions in the January rolling window: 5.8 percent to 3.1 percent, moving out of SMMP exposure
- Average representment preparation time: 26 minutes to 6 minutes per case
- Net chargeback loss across the wave: $246,000 to $88,000, a 64 percent reduction
- Rolling reserve released, and processing terms held at renewal
The instructive detail is how the ratio improvement split. Roughly 40 percent came from the higher denominator, 35 percent from disputes deflected before they became chargebacks, and 25 percent from representments won on dispatch evidence. No single lever would have cleared the threshold alone.
See what your February ratio is projected to be and what dispatch evidence would recover across the surge window. 30 minutes. No commitment.
How Do You Win Peak-Season Representments?
Winning rate is a function of two things: whether the evidence exists, and whether you can retrieve and submit it inside the window while several hundred other cases are queued behind it.
What decides a first-party misuse representment:
The issuer is answering one question. Did this cardholder receive what they ordered, in the condition ordered, at the address they gave? Your submission either answers that with documentation or it does not.
The evidence set that answers it:
- Order ID-linked dispatch record showing item, quantity, condition, and shipping label in one frame
- Calibrated dispatch weight, which independently corroborates contents against any short-shipment assertion
- Tamper-evident seal documentation, which addresses substitution claims
- Carrier tracking with delivery confirmation, and signature or photo confirmation where order value justifies it
- Transaction and customer data tying the order to the disputing cardholder, including prior undisputed purchase history where it exists
- The product listing as it appeared at time of order, which addresses not-as-described assertions
Three peak-specific execution rules that change outcomes more than evidence quality does:
Rule 1: Retrieval speed is a win-rate variable, not a convenience. At 400 cases in a six-week window, a process taking 25 minutes per case consumes over 160 hours. Cases get dropped, and a dropped case is a loss that still counts in the ratio. Sub-five-minute retrieval is what makes full coverage achievable.
Rule 2: Prior purchase history is the most underused evidence you already have. A disputing cardholder with three prior undisputed orders from the same device and address is a materially different case from a first-time buyer, and many merchants never include it.
Rule 3: Submit complete or do not submit. Partial submissions consume the one representment opportunity available on that case. If a piece is missing, the answer is to fix the capture layer before next peak, not to submit a weak file now.
Merchants submitting complete evidence sets on first-party misuse cases resolve them at 70 to 85 percent. Merchants submitting tracking and a written statement resolve them at roughly 20 to 30 percent. Across a peak-season wave, that gap is usually a six-figure number.
Where TrackVid Fits in Your Chargeback Defense
Steps 1, 2, 3, and 5 are planning, payments configuration, and staffing work your existing team can run. Step 4, the dispatch evidence layer, is the piece that needs infrastructure, and it is the piece that decides representment outcomes in February.
TrackVid is a video proof and claim management platform used by 1,100+ ecommerce sellers on Shopify, WooCommerce, Amazon, eBay, TikTok Shop, Flipkart, Myntra, AJIO, Nykaa, Meesho, and Snapdeal. Officially authorized by Snapdeal. Brands using TrackVid include Rare Rabbit, Wrogn, The Indian Garage Co, The Bear House, HRX, Nike, Jordan, Tommy Hilfiger, and Snitch.
For the BFCM chargeback surge specifically, TrackVid delivers:
- Automatic Order ID-linked packing video at every pack station, with no workflow change and no added seconds per parcel, which is the only version that survives peak volume intact.
- Calibrated weight and tamper-evident seal capture on every order, providing the corroborating detail that separates a strong representment from an assertion.
- Retrieval by Order ID in under two minutes, which is what converts a 400-case February queue from unmanageable into routine.
- Evidence packaged for representment submission, so a November parcel is defensible in February using an artefact captured before anyone knew the dispute was coming.
- One capture layer covering both dispute channels. The same record defends a card chargeback and a marketplace claim, which matters because peak season generates both simultaneously.
- Works with existing warehouse cameras, with setup typically under 15 minutes, making a pre-peak deployment realistic rather than aspirational.
WROGN's pilot data shows the pattern at scale. Across 94,904 packing videos and 95,836 tracked orders, 868 claims were filed with structured dispatch evidence, and approval moved from 42.3 percent in June to 60.3 percent in July within a single month of systematic capture.
For the surrounding playbooks, see our Black Friday Return Fraud playbook, Sale Season Operations Playbook, Customer Risk Scoring playbook, Order Accuracy playbook, and How to Build Customer Trust in an Online Store at trackvid.in.
In 30 minutes our team walks through last season's dispute data, projects your February ratio, and shows what a pre-peak evidence deployment looks like in your operation.
Five Questions to Audit Your BFCM Chargeback Surge Exposure
1. What was your chargeback ratio in February, calculated against February settled transactions? If you only know your annual average, you do not know your enforcement risk, because enforcement is measured monthly.
2. What are your projected February settled transactions this coming year, and what dispute count would put you over 1.5 percent against that number? This is the single most useful figure in your peak-season plan.
3. Do you monitor TC40 fraud reports through December, before the corresponding chargebacks arrive? These are the earliest available warning and most merchants never open them.
4. Can you retrieve complete dispatch evidence for any November order in under five minutes during February? If not, your February win rate is capped regardless of how good your evidence policy looks on paper.
5. Who owns the representment queue in February, by name, with forecast capacity? If your peak plan ends on December 31, it ends one month before the problem starts.
The evidence that wins February is captured in November. There is still time. 30 minutes. No commitment.
Frequently Asked Questions
What is the BFCM chargeback surge?
The concentrated wave of card disputes generated by Black Friday and Cyber Monday orders, arriving between late December and early March and peaking in February. It combines true fraud, first-party misuse, and confusion disputes. Its danger is ratio timing: November disputes are measured against January and February settled volume, which collapses after peak.
Why did my chargeback ratio spike in January?
Because chargeback ratios divide disputes by settled transactions in the month the dispute posts, not the month the order was placed. November disputes land in January and February, when your transaction volume is at its annual low. The same absolute dispute count can produce a ratio three to five times your annual average.
When do Black Friday chargebacks actually hit?
Filings accelerate in January once cardholders reconcile holiday statements, and arrival peaks in February. Card networks generally allow 120 days from transaction or expected delivery to file, so tail disputes on late-November orders run into March. Sift data shows peak account takeover surges converting into disputes the following quarter.
What is the VAMP threshold in 2026?
Visa tightened the VAMP merchant Excessive threshold from 2.2 percent to 1.5 percent on April 1, 2026 across the US, Canada, EU, and APAC, with CEMEA retaining 2.2 percent. Fines run at $8 per dispute with no warning tier. Merchants under 1,500 combined monthly fraud reports and disputes sit outside formal monitoring.
How is the VAMP ratio calculated?
VAMP Ratio equals reported fraud transactions plus disputes, divided by total settled transactions in the measurement month. A single bad transaction can count twice if the issuer reports it as fraud (TC40) and the cardholder later escalates to a chargeback (TC15). Both records land in the numerator.
What is Mastercard SMMP?
The Scam Merchant Monitoring Program, which took full effect July 24, 2026. It can flag card-not-present merchants once combined refunds and chargebacks cross 5 percent of transactions in a rolling 30-day window, with no warning tier. January is uniquely exposed because refunds and chargebacks peak together after the holidays.
What happens if I cross the chargeback threshold?
Fines are the smallest consequence. Acquirers typically require a remediation plan and impose a rolling reserve withheld from settlements, which lands in Q1 when peak inventory is already paid for. Persistent breaches raise processing rates at renewal and can end in account termination and high-risk processing.
How do I lower my chargeback ratio before peak season?
Attack numerator and denominator together. Fix your billing descriptor, enrol in pre-dispute alerts, and monitor TC40 reports to cut disputes. Extend the promotional calendar and run a January retention campaign to raise settled volume in the measurement months. Capture dispatch evidence pre-peak to win representments.
How do I win chargebacks after Black Friday?
Submit complete evidence inside the window: Order ID-linked dispatch record, calibrated weight, tamper-evident seal, tracking with delivery confirmation, transaction data linking cardholder to order, and prior undisputed purchase history. Complete sets resolve first-party misuse at 70 to 85 percent versus 20 to 30 percent for tracking plus a written statement.
BFCM chargeback surge kaise handle kare?
September mein February ka ratio forecast karo, kyunki November ke disputes February ki settled transactions se divide hote hain. Billing descriptor theek karo, pre-dispute alerts lagao, aur peak se pehle har order ki Order ID-linked packing video capture karo. Complete evidence se representment win rate 70 se 85 percent tak jaata hai.
Sources: Visa Acquirer Monitoring Program documentation 2026, Merchant Risk Council VAMP threshold guidance 2026, Mastercard Scam Merchant Monitoring Program guidance 2026, Mastercard Excessive Chargeback Program guidance, ACI Worldwide 2025 Peak Season eCommerce Analysis, Sift Global Data Network BFCM 2025 Fraud Trends, NRF and Happy Returns 2025 Retail Returns Landscape, Chargebacks911 2026 Chargeback Field Report, TrackVid platform data across 1,100+ sellers, WROGN pilot data (94,904 videos, 95,836 tracked orders, 868 claims filed)
Threshold values and programme rules are set by the card networks and acquirer contracts and change periodically. Verify against your acquirer's current reporting before making operational decisions.
TrackVid is a video proof and claim management platform used by 1,100+ ecommerce sellers on Shopify, WooCommerce, Amazon, eBay, TikTok Shop, Flipkart, Myntra, AJIO, Nykaa, Meesho, Bol.com, Zalando, MyDeal, and Snapdeal. Officially authorized by Snapdeal. Brands trusting TrackVid include Rare Rabbit, Wrogn, The Indian Garage Co, The Bear House, HRX, Nike, Jordan, Tommy Hilfiger, and Snitch. Learn more at trackvid.in.






Get the Marketplace Claim Recovery Checklist
A 12-point checklist used by 1,100+ sellers to recover 85-90% of marketplace claim losses. Free, instant access.
- Marketplace-specific evidence formats (AJIO, Flipkart, Amazon, Myntra)
- Claim window deadlines for every major platform
- The 6-step process that pushes approval from 85-90%
- Common rejection reasons and how to avoid them
No spam. Unsubscribe anytime. Used by sellers at Rare Rabbit, HRX, Da Milano + 1,100 more.
Stop Losing Money to Fake Returns
Join 1,100+ sellers who recover lakhs every month with TrackVid